Getting nervous about the stock market? Take a look at the 200-day moving average

Geert Van Herck
Chief Strategist KEYPRIVATE
June 08, 2022
(updated September 22, 2022)
3 minutes to read
Since 2022, the world's key stock markets have been staring losses of 10% or more in the face. Naturally, this only increases stress for investors. We're often asked how investors can protect themselves against downwards shocks such as these on the stock market. In this article, we give investors some plain advice: take a look at the 200-day moving average, as it represents a reliable arbitrator between rising and falling trends.
Risk management is essential when it comes to managing a globally diversified equity portfolio. The main risk to which equity investors are exposed is falling prices, which could lower the portfolio's return. It goes without saying that people are constantly searching for ways to soften the impact of falling prices. Many studies refer to the 200-day moving average as a solution, but what does this mean exactly? Below, we take a look at the most important conclusions from the latest studies available to us.
First, let's take a moment to explain what the 200-day moving average is. To calculate this average, the closing price of a stock market index (or another financial instrument) over the last 200 days is added together, with the result divided by 200. This average is a popular tool that helps determine the direction of the current trend as well as reduce the impact of random spikes. More specifically, if the price of your index or share exceeds the 200-day moving average, you become an investor on the stock market. If it is below the moving average, then you're out.
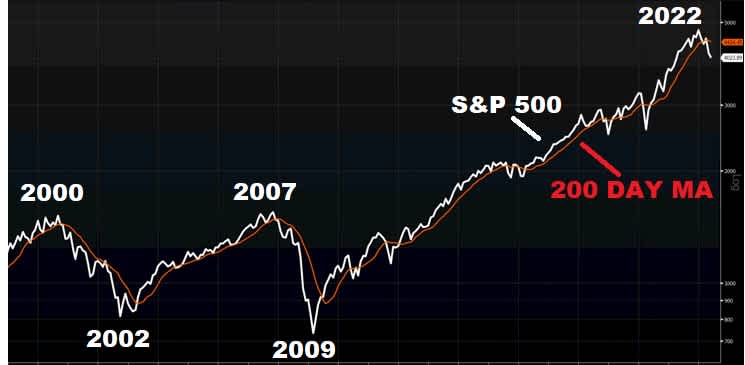
Graph 1 shows the trend in the American S&P 500 index (white line) and the 200-day moving average (red line). One important observation to note is that the 200-day moving average does a good job of absorbing major downward shocks on the market. Look at the periods from 2000 to 2002 and 2007 to 2009 to see how the index gives a sell signal in 2000 and 2007. As a result, investors avoid huge price losses and receive a signal to re-enter the market in 2002 and 2009.
Graph 1: S&P 500 vs 200-Day Moving Average

Source: Bloomberg
An often-mentioned downside is that a sell signal is sometimes given and, a few days later, the index or share jumps above the 200-day moving average. As an investor, you will therefore have to execute additional transactions to reduce and then increase positions. We would therefore advise you not to sell everything straight away in the event of a sell signal (whether an index or a share in your portfolio), but to sell 20% or 25% of the position in the first instance. If the sell signal remains in place, you can then sell more. As a general rule, however, the 200-day moving average remains a good indicator of how to absorb downward shocks in a portfolio.
Finally, we would like to shed some light on another statistic we encountered in a study some time ago. As an example, Table 1 shows us that when the S&P 500 (on which the study was conducted) is above the 200-day moving average, an average return of 2.44% is recorded over the next three months. Moreover, the success ratio (the likelihood of making gains) stands at 70%.
Table 1: S&P 500 Closing Price Above 200-Day Moving Average
| Statistics | Signal |
|---|---|
Probability of Gain | 70.10% |
Probability of Loss | 29.90% |
Mean Return | 2.44% |
Source: Potomac Fund Management
Table 2 shows the reverse: when the S&P 500 index is below the 200-day moving average, the average return over the next three months falls to 1.57% and the success ratio stands at just 57%. In other words, falling below the 200-day moving average has a significant impact on expected returns.
Table 2: S&P 500 Closing Price Below 200-Day Moving Average
| Statistics | Signal |
|---|---|
Probability of Gain | 56.97% |
Probability of Loss | 43.03% |
Mean Return | 1.57% |
Source: Potomac Fund Management
Conclusion
Various studies offer crystal-clear results – the 200-day moving average offers a good indicator of how to manage the downward risk in an equity portfolio. Investors can therefore reduce their equity exposure if prices fall below the moving average and increase their exposure again if prices rise above the average. So be sure to jump in and take advantage!
Geert Van Herck Chief Strategist KEYPRIVATE


