Graph of the Week: Magnificent 7 vs 2000s Tech Bubble

Geert Van Herck
Chief Strategist KEYPRIVATE
October 10, 2024
2 minutes to read
When you look at the US stock exchange, the fantastic performance of the Magnificent Seven (Apple, Microsoft, Google, Amazon, Meta, Tesla and Nvidia) stands out.

Source: Visual Capitalist
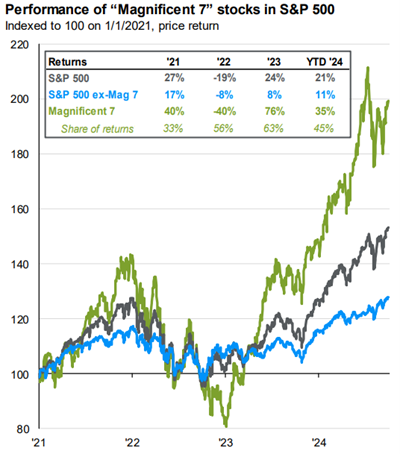
These high-performing companies have been responsible for the majority of S&P 500 returns in recent years. The current year is no different. As can be seen in the following graph, at the end of September the S&P 500 return was 21% from the start of 2024. The Magnificent Seven outperformed this by nearly 50%, returning close to 35%.

Source: J.P. Morgan
They are doing so well that many stock market analysts fear the next bubble. Although these companies' products and services have increasingly become part of our daily lives, they appear to be calling up memories of the 2000s tech bubble.
Is history repeating itself?
Is this a bubble that's about to burst? Let's take a look at the situations then and now.
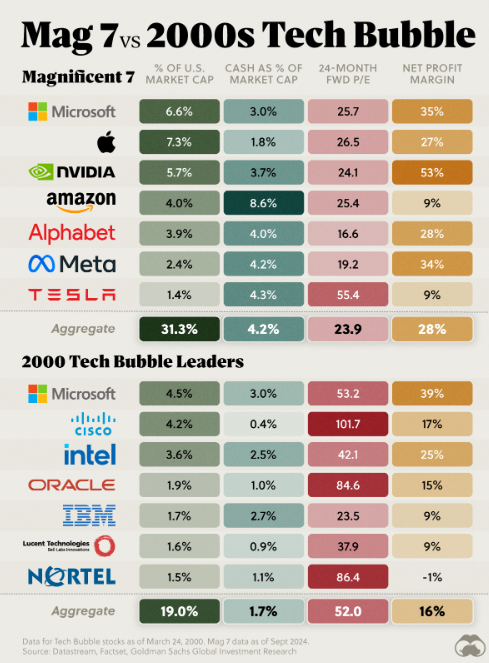
If you compare the Magnificent Seven to the seven most important technology shares from the tech bubble, the current stock market weighting is higher, with 31% of market capitalisation now and only around 19% back then.
This level of concentration might be considered risky, although we'd like to note that the Magnificent Seven are comparatively better off than the previous generation of companies back in 2000:
- Higher profit margins
- Large cash reserves to invest in new products and services
- 'Accurate' valuations, not exaggerated as for major tech shares in the late '90s
Still concerned?
Do you still feel the current US tech exposure in the S&P 500 is a bit high? 'Equal weight' S&P 500 trackers estimate that technology accounts for only 13.50% of the index, compared to 31% for the market-weighted version.


