Is it the tech giants that are responsible for the record S&P 500 performance? A quick fact check!

Geert Van Herck
Chief Strategist KEYPRIVATE
January 04, 2022
(updated August 21, 2024)
3 minutes to read
You’ve probably already read this. Without the strong performance of the large US technology stocks, the S&P 500 would have achieved a much lower return in 2021. The huge returns on shares such as Apple, Microsoft and Google are given as the explanation for the US stock market being touted worldwide as the best destination for your portfolio this year. But is it correct? Can we actually say that? Or should we banish this comment to the realms of fairy tales? A fact check is in order, and tends to point in the direction of a fairy tale.
Why?
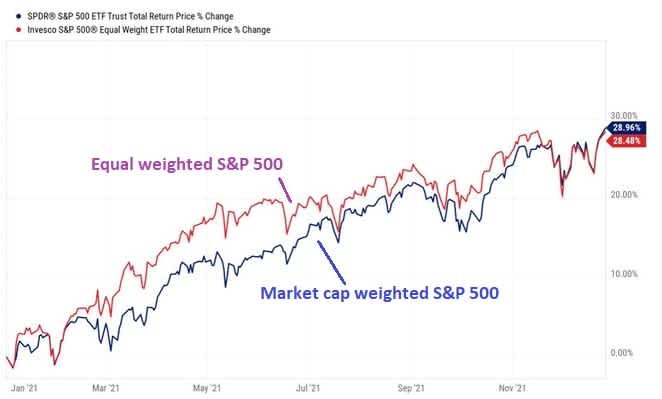
Take a look at Figure 1. This shows us the price performance of two trackers. The "market cap weighted S&P 500" tracker is made up of the 500 shares in the S&P 500, with the largest shares being given the greatest weighting. Alongside that, we have the "equal weighted S&P 500" tracker. Each share in the S&P 500 is given an equal weighting. Apple’s weight in the "market cap weighted S&P 500" is about 6%, while in the other tracker it is only 0.23%.
What do we see?
The price performance this year is virtually identical for both trackers. They each rose by over 28% (in USD). This means that almost all sectors played a part in the American stock market success.
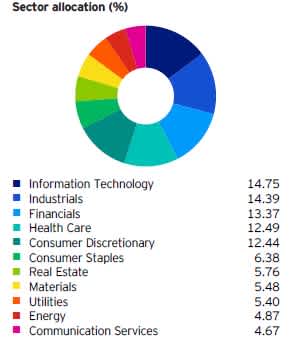
If it were only technology that performed excellently, the market cap weighted S&P 500 would score much higher, as technology accounts for over 25% of this index (see the sector allocations in Tables 1 and 2). The "equal weighted S&P 500", nearly halves the weighting of the tech sector. The industrial sector weighs almost twice its weight in the "market cap weighted S&P 500"! The balance between sectors is much more even in the "equal weighted S&P 500". In other words, the dominance of the tech sector virtually disappears.
Figure 1: "Equal weighted S&P 500" vs. "Market cap weighted S&P 500"

Source: All Star Charts
Table 1: "Market cap weighted S&P 500" broken down by sector

Source: SPDR
Table 2: "Equal weighted S&P 500" broken down by sector

Source: Invesco
Conclusion
The US stock market put in a strong performance this year, because many listed companies saw their share prices jump. So it was not just the technology companies that delivered a stock market success. We believe that it never hurts to look below the surface a little.
The flood of financial and economic news on numerous social media makes it difficult for anyone to see the wood for the trees. We will continue to strive to keep doing so during 2022.
Geert Van Herck Chief Strategist KEYPRIVATE


